
SIBYL Toolbox for real-time ESAC Array Processing and building monitoring
The graphical user interface toolbox provides a real-time Extended Spacial AutoCorrelation Array analysis to obtain a dispersion curve and Vs30 value (using the Albarello method). Subsequently, a SVD (single value decomposition) inversion can be performed to obtain a shear wave velocity profile. A building monitoring feature is included to provide results of the Spectra and Interferometry analysis. The main window is divided into 7 tabs, referring to Info, Data source/Parameter, ESAC, SVD Inversion, Building Monitoring, About and Settings. A demonstration of the use of this tool is shown here.
Array part:
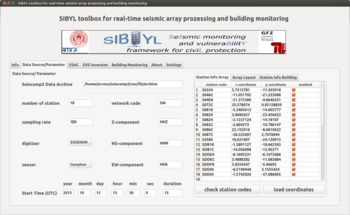
The data source/ parameter Tab allows the user to configure different parameter, such as the number of stations, network codes, sampling rates, channel identifier, digitizer and sensor specific constants.
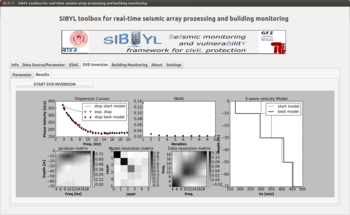
Within the SVD Inversion Tab, once the parametrisation of the shear wave velocity model is done and some parameters defined, the results may be viewed, showing the obtained shear wave velocity model, the Jacobian matrix, model resolution matrix, data resolution matrix, misfit, and dispersion curves.
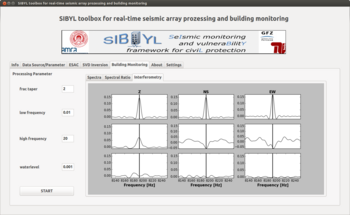
Building monitoring part:
The processing parameters defining the tapering and filtering of the recorded signal can be entered, with the obtained results including spectra and interferometry plots for the different components.